There are only four types of metrics – quality, scale, engagement, and revenue. Effective metrics track real value, are sensitive, and easy to understand. When communicating metrics, you should call out how the operational metrics that measure progress against your current tactics will drive the topline metrics everyone at your company understands.
Categories of Metrics
Product metrics fall in to four categories:
- Quality – How good is your product at doing what it says it does?
- Scale – How many people use your product?
- Engagement – How deeply do people engage with your product?
- Revenue – How much money do you make?
These categories are deeply interconnected — scaling your userbase may drive down your overall engagement rates as new, less engaged users come in. Putting ads in to a product may drive down retention and engagement. Driving up engagement is often one of the best ways to drive growth in the long term, etc.
In general, you strive to make your product great for a small number of people, get more people to use this valuable product, deepen engagement with those people, then figure out how to make money from them, and loop back around to figure out how to build a high quality experience for an expanded set of people.
Characteristics of a Good Metric
- Represent real value – The more closely a metric represents the actual value to users and customers the more likely it is to guide a company in the right direction.
- Sensitive – a good metric will move up/down based on work you do more than exogenous factors.
- Simple – simple counts and time series are surprisingly effective.

For example, “number of people using our product on a given day” aka DAU is real value (more people using your product is good), sensitive (if you send a lot of notifications or if you are in the press, this will go up), and simple because you can look at the graph and quickly know if things are going well.
“The ratio of photos to videos uploaded per person” is not clearly valuable (why does this ratio matter?), sensitive (the ratio may not change a lot unless you fundamentally change your product in a big way), and is not simple (is the above shape good? is it going up because people are uploading more photos or the video upload flow is broken? what would you expect to be a “good shape” to that curve?)
Communicating with Metrics
It’s easy to lose context on why certain metrics are a priority and how all of a company’s metrics fit together. As an employee, this loss of context can feel like there is no strategy. It can lead to teams that struggle to communicate because they do not have context on why other teams’ metrics matter.
The reason this happens is that most people conflate topline and operational metrics.
Topline metrics measure progress towards your mission. They are high level and stay consistently tracked for years. These are the metrics your board of directors want to know about, such as daily active users (DAU) or revenue. You will have only one or two topline metrics for each of the four types of metrics (quality, scale, engagement, revenue).
Operational metrics measure the progress of strategies and tactics. They are in service of a topline metric. For example, using search ads to acquire customers is a tactic, measured by cost of customer acquisition using search ads. The overall strategy you are using may be to pay for new users, measured by an overall blended CAC. This strategy is in pursuit of monthly active users (a topline growth metric).
Operational metrics will change as tactics or strategies evolve. However if you articulate how operational metrics roll in to topline metrics, this will not feel jarring because people will understand how the old and new operational metrics were in pursuit of the topline metric. You can/should also reinforce that topline metrics are proxies for the value you want to create in the world, not the end unto themselves, to keep everyone grounded and focused.
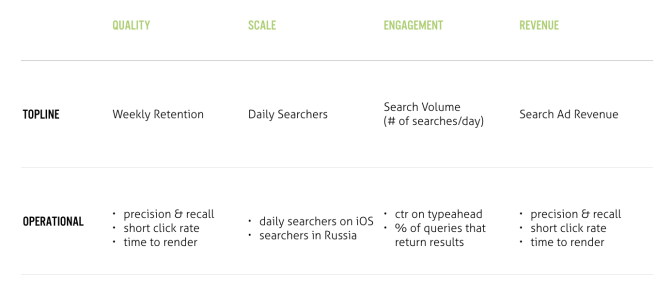
Example 1: Google Search
Here is a simplified example using Google Search. There are many possible operational metrics for each topline metric, and the operational metrics you focus on will change over time.
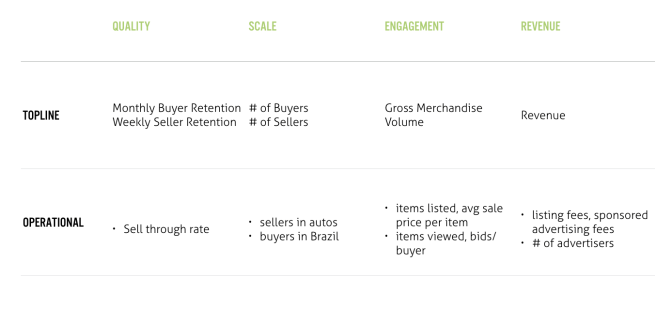
Example 2: eBay
This is a more complicated example because you have a two-sided marketplace with buyers and sellers, and it’s important to measure the health of both sides of the marketplace.
Risks
The biggest risk in creating a metrics informed culture is that over time, people conflate metrics and goals. Metrics are a proxy for value and an abstraction to help you measure progress. Don’t lose sight of the real goals: to create real value for customers. If you lose sight of the value you are ultimately creating, you can move metrics for the sake of moving metrics, picking incorrect metrics targets, and ultimately will be disrupted by another company that actually creates real value for customers.

2 thoughts on “Metrics”